Exploring Financial Chart Performance: A Comparative Analysis
μPlot - A small (~45 KB min), fast chart for time series, lines, areas, ohlc & bars (MIT Licensed)
When it comes to charting libraries, speed and efficiency are paramount considerations. Among the myriad options available, μPlot emerges as a standout contender. As a fast and memory-efficient Canvas 2D-based charting solution, μPlot excels in plotting various data types, including time series, lines, areas, OHLC (open-high-low-close), and bars. Its impressive performance is evident from its ability to generate an interactive chart containing 150,000 data points in just 90 milliseconds from a cold start. Furthermore, its scalability is noteworthy, achieving approximately 31,000 points per millisecond in a linear fashion. Beyond its rapid initial rendering, μPlot distinguishes itself with unparalleled zooming and cursor responsiveness, outperforming its competitors in this aspect.
Moreover, despite its remarkable speed, μPlot maintains a compact footprint, weighing in at around 50 KB. This makes it likely the smallest and fastest time series plotter available that doesn't rely on context-limited WebGL shaders or WebAssembly (WASM), which typically incur higher startup costs and larger code sizes.
For benchmarking purposes, a demonstration featuring 166,650 data points is accessible at the following link: 166,650 point benchmark.
However, while μPlot excels in many scenarios, it may face limitations when tasked with delivering sustained 60 frames per second (fps) performance, particularly with massive streaming datasets. In such cases, it's important to optimize the rendering pipeline. For real-time signal or waveform visualizations necessitating consistent high performance, WebGL remains the preferred tool. Alternative solutions include danchitnis/webgl-plot, huww98/TimeChart, epezent/implot, or commercial products like LightningChart®.

Features
- Multiple series w/toggle
- Multiple y-axes, scales & grids
- Temporal or numeric x-axis
- Linear, uniform or logarithmic scales
- Line & Area styles (stroke, fill, width, dash)
- Pluggable path renderers linear, spline, stepped, bars
- Zoom with auto-rescale
- Legend with live values
- Support for IANA Time Zone Names & DST
- Support for missing data
- Cursor sync for multiple charts
- Focus closest series
- Data streaming (live update)
- High / Low bands
- A lean, consistent, and powerful API with hooks & plugins
In order to stay lean, fast and focused the following features will not be added:
- No data parsing, aggregation, summation or statistical processing - just do it in advance. e.g. https://simplestatistics.org/, https://github.com/leeoniya/uDSV
- No transitions or animations - they're always pure distractions.
- No collision avoidance for axis tick labels, so may require manual tweaking of spacing metrics if label customization significiantly increases default label widths.
- No stacked series: see "Stacked Area Graphs Are Not Your Friend" and a horrific demo. While smooth spline interpolation is available, its use is strongly discouraged: Your data is misrepresented!. Both visualizations are terrible at accurately communicating information.
- No built-in drag scrolling/panning due to ambiguous native zoom/selection behavior. However, this can be added externally via the plugin/hooks API: zoom-wheel, zoom-touch.
Benchmarks done on this hardware:
- Date: 2023-03-11
- AMD Ryzen 7 PRO 5850U @ 1.9GHz, 32GB RAM
- EndeavourOS/Arch (KDE/Plasma), Chrome 113.0.5638.0 (64-bit)
- 4K display scaled to 1440p (1.5 devicePixelRatio)
| lib                    | size    | done    | js,rend,paint,sys | heap peak,final | mousemove (10s)     |
| ---------------------- | ------- | ------- | ----------------- | --------------- | ------------------- |
| uPlot v1.6.24          | 47.9 KB |   34 ms |   51   2   1   34 |  21 MB   3 MB   |  218  360  146  196 |
| Chart.js v4.2.1        |  254 KB |   38 ms |   90   2   1   40 |  29 MB  10 MB   | 1154   46  165  235 |
| Flot v3.0.0            |  494 KB |   60 ms |  105   5   1   52 |  41 MB  21 MB   | ---                 |
| ECharts v5.4.1         | 1000 KB |   55 ms |  148   3   1   35 |  17 MB   3 MB   | 1943  444  203  208 |
| dygraphs v2.2.1        |  132 KB |   90 ms |  163   2   1   33 |  88 MB  42 MB   | 1438  371  174  268 |
| LightningChart® v4.0.2 | 1300 KB |  --- ms |  250   2   1   33 |  33 MB  13 MB   | 5390  120  128  325 |
| CanvasJS v3.7.5        |  489 KB |  130 ms |  266   4   1   35 |  98 MB  69 MB   | 1030  445   90  246 |
| dvxCharts v5.1.0       |  373 KB |  160 ms |  264  23   1   62 | 100 MB  61 MB   |  687  779  206  197 |
| Highcharts v10.3.3     |  413 KB |  --- ms |  416   7   1   38 |  97 MB  55 MB   | 1286  824  205  242 |
| Plotly.js v2.18.2      | 3600 KB |  310 ms |  655  14   1   40 | 104 MB  70 MB   | 1814  163   25  208 |
| ApexCharts v3.37.1     |  503 KB |  685 ms |  694   9   1   33 | 175 MB  46 MB   | 1708  421  106  207 |
| ZingChart v2.9.10      |  871 KB |  681 ms |  717   7   1  105 | 290 MB 195 MB   | 9021  305   41   71 |
| amCharts v5.3.7        |  625 KB |  --- ms | 1601   3   3   46 | 147 MB 121 MB   | 9171   71  460  167 |
Full size: https://leeoniya.github.io/uPlot/demos/multi-bars.html
Raw data: https://github.com/leeoniya/uPlot/blob/master/bench/results.json
Source: https://github.com/leeoniya/uPlot
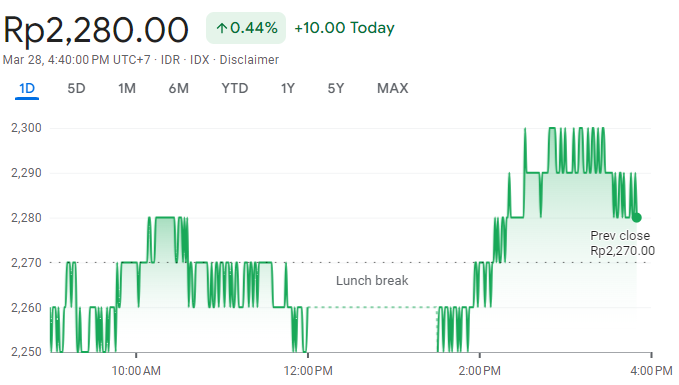
Headline image: Google Finance - MDKA Mar 28, 4:40:00 PM


{{ 'Comments (%count%)' | trans {count:count} }}
{{ 'Comments are closed.' | trans }}